Get in touch with Suzhou UDTECH Technology Co., Ltd. Company

How to Read Filter Cartridge Pressure Drop Without False Comparisons


Filter cartridge pressure drop is the upstream-minus-downstream static-pressure difference between defined tap locations at a stated flow and fluid condition. The value may include cartridge, housing, ports, fittings, and adjacent piping unless the measurement boundary is named. Only compare values when flow, fluid or viscosity, temperature, housing, cartridge shape, tap locations and clean or loaded condition are the same.
A pressure reading can look precise and still be worthless for a purchase decision. A curve without conditions can’t tell you whether one cartridge is less restrictive, whether housing caused the loss, or whether a loaded element was compared to a clean element.
The method can be applied to general industrial liquid service but an engineer would still define application, chemical compatibility, and operating environment. Gas service and other equipment would need a test basis.
Key takeaway
A pressure-drop value becomes comparable only after its two tap locations, operating conditions, hardware boundary, and cartridge state travel with the number.
The practical sequence is simple: define the boundary, save both gauge readings, match the test basis, separate measured subtraction from prediction, keep retention and hydraulics distinct, set a site rule, and preserve traceable evidence. The details below turn this into an RFQ and operating record.
What Does Filter Cartridge Pressure Drop Measure?
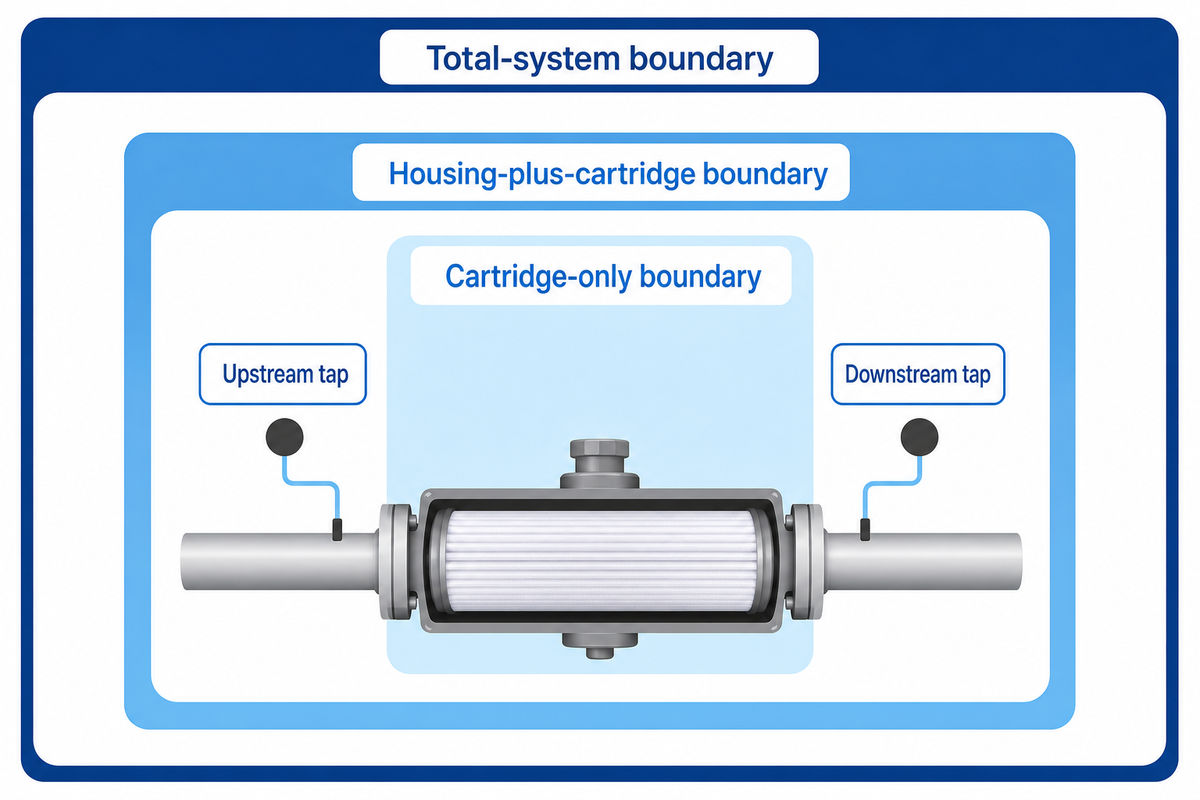
Filter cartridge pressure drop shows the difference between two pressure taps, not an unnamed property of the cartridge. A cartridge-only boundary, housing-plus-cartridge boundary, and a broader system boundary can lead to different values for the same flow. Record the hardware for every case before forming a judgement.
Identify the upstream tap by its physical location, not just its label as ‘inlet.’ Identify the downstream tap in the same way, and record the other items (ports, valves, etc.) between the taps. This record is the Pressure-Drop Boundary Ledger.
Write ‘differential pressure across the filter’ only after the word ‘filter’ has a physical boundary. Otherwise, the phrase may silently combine several components and prevent a later reviewer from reproducing the measurement.
Pressure-Drop Boundary Ledger
| Upstream tap | Physical location and elevation |
| Downstream tap | Physical location and elevation |
| Included hardware | Housing, ports, valves, fittings, nearby pipe |
| Test condition | Fluid, flow, temperature, cartridge state |
| Raw readings | Upstream, downstream, units, time |
An empty-housing test can help separate hardware loss, but subtraction is defensible only when cartridge removal does not materially change the relevant flow path and both runs share the same conditions. A buyer may claim hardware loss is small; even so, the boundary must be disclosed because a single assembly value can’t prove a cartridge-only result.
What is pressure drop in a cartridge filter?
Filter cartridge pressure drop is the difference between static pressure measured at defined upstream and downstream taps while flow and fluid conditions are recorded. The result describes everything in between the taps. For the wider system boundary, see the industrial filtration process guide. Without the boundary, flow, temperature, housing, and clean or loaded state, the value cannot support a fair cartridge comparison.
Reference capsule: ISO 3968 frames differential-pressure evaluation around stated assembly parts and operating variables. See the ISO 3968 lifecycle record. A reported 0.20 bar value should therefore carry its tap boundary and test condition; the standard’s controlled hydraulic scope does not convert that example into a universal cartridge limit.
Separate Clean, Loaded, and Total-System Pressure Drop
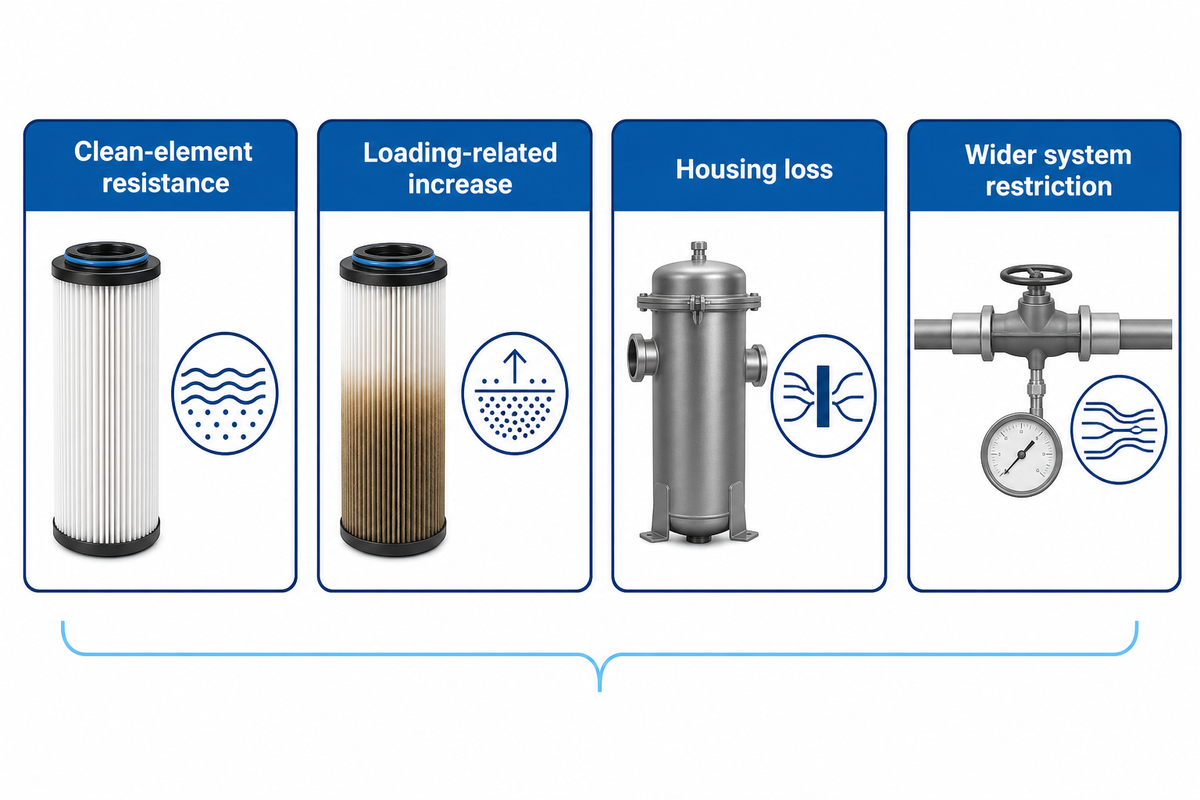
Clean-element resistance, loading-related increase, housing loss, and wider system restriction are distinct quantities. Keep upstream and downstream pressure, differential pressure, flow, temperature, and cartridge state for each sample. A differential may represent added resistance, but it won’t indicate the location of that added resistance.
Establish a clean baseline after installation and stable operation. Trend subsequent readings against that baseline and consider processed-volume or time context. If flow or viscosity changes, flag the point rather than connecting the points with a smooth line.
Contaminant loading can raise resistance, yet one trend cannot predict filter life or service life without a defined terminal criterion. A cleaner cartridge may indicate lower loss, but the maintenance record must explain what changed.
| Observed change | What it may include | Evidence to retain |
|---|---|---|
| Clean baseline | Element plus named boundary | Paired readings and conditions |
| Rising differential | Loading, higher flow, colder fluid, blocked path | Trend, flow, temperature, inspection |
| Falling differential | Lower flow, bypass, seal leak, damage, sensing fault | Outlet quality and diagnostic checks |
| Housing/system loss | Ports, valves, piping, downstream restriction | Empty-housing or sectional readings |
Absolute pressure should be kept on both sides of a differential because the same differential can hide different inlet and outlet conditions. Measurement-scope reference: ISO 3968. Outlet-quality evidence would provide another independent signal if the consequence of filtration mattered.
A Water Technology example describes 90 gpm service and at least five 30-inch cartridges for the stated comparison; the useful lesson is not to reuse that capacity elsewhere, but to keep flow, cartridge size, count, and hardware configuration attached to every loss comparison.
Use the Same-Basis Pressure-Drop Envelope
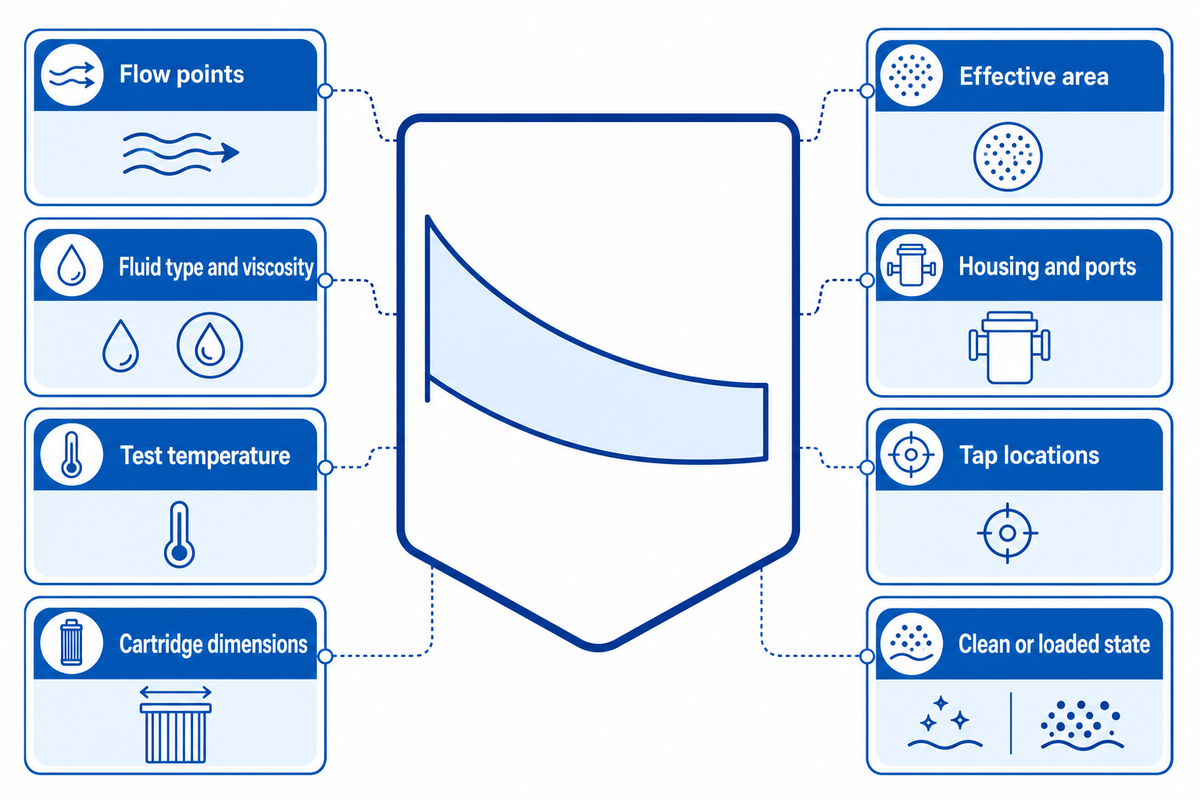
Two pressure-drop curves are comparable only when their basis matches, or a documented normalization method is valid. Align flow points, fluid types and viscosities, test temperatures, cartridge dimensions, effective areas, housings, ports, tap locations, conditioning states, and clean/loaded status. Rankings should be rejected when critical field data are missing.
The Same-Basis Curve Envelope gives each field one of three dispositions: match, normalize with a validated basis, or reject. Normalizing with the same nominal flow isn’t sufficient if one curve uses water at one temperature and the other doesn’t state viscosity, or if cartridge length and housing ports are different.
Some suppliers group related products as series filters. The series filter cartridges within one catalog may still have different geometry or media. Thus, a series cartridge name can’t be substituted for matched flow rates and construction fields.
| Field | Compare | Normalize only if | Reject when |
|---|---|---|---|
| Flow grid | Corresponding measured points | Method and range are validated | Only one unmatched point exists |
| Fluid properties | Identity, temperature, viscosity | Property data and regime fit | Fluid or temperature is absent |
| Geometry | Length, diameter, pleats, area | Model treats the actual design | Internal geometry is unknown |
| Boundary and state | Housing, taps, clean or loaded | A paired correction is demonstrated | Included loss is ambiguous |
Even when external conditions are equal, it can’t be assumed that pleats, spacers and/or other internal paths are fixed. Keep any normalization within its validated pressure and flow range. Prefer measured points where structural or loading behavior changes.
Can two filter pressure-drop curves be compared directly?
Only when measurement boundaries, flow points, fluid properties, temperature, cartridge geometry, housing and ports, tap locations, conditioning and loading state all match. Check measured points before fitted lines. A validated model may normalize differences, but keep extrapolation outside that range out of the ranking. In the absence of a critical field, check the test record or reject the comparison.
Reference capsule: A defensible overlay might compare measured points at 10, 20 and 30 L/min only after every basis field is checked. Peer-reviewed literature documents behavior that’s condition-dependent and model deviation, therefore a smooth normalized curve shouldn’t outrank corresponding measured points outside its validated range. Model-validation context: UWM porous-media research.
How to Calculate Pressure Drop Without Inventing a Universal Curve
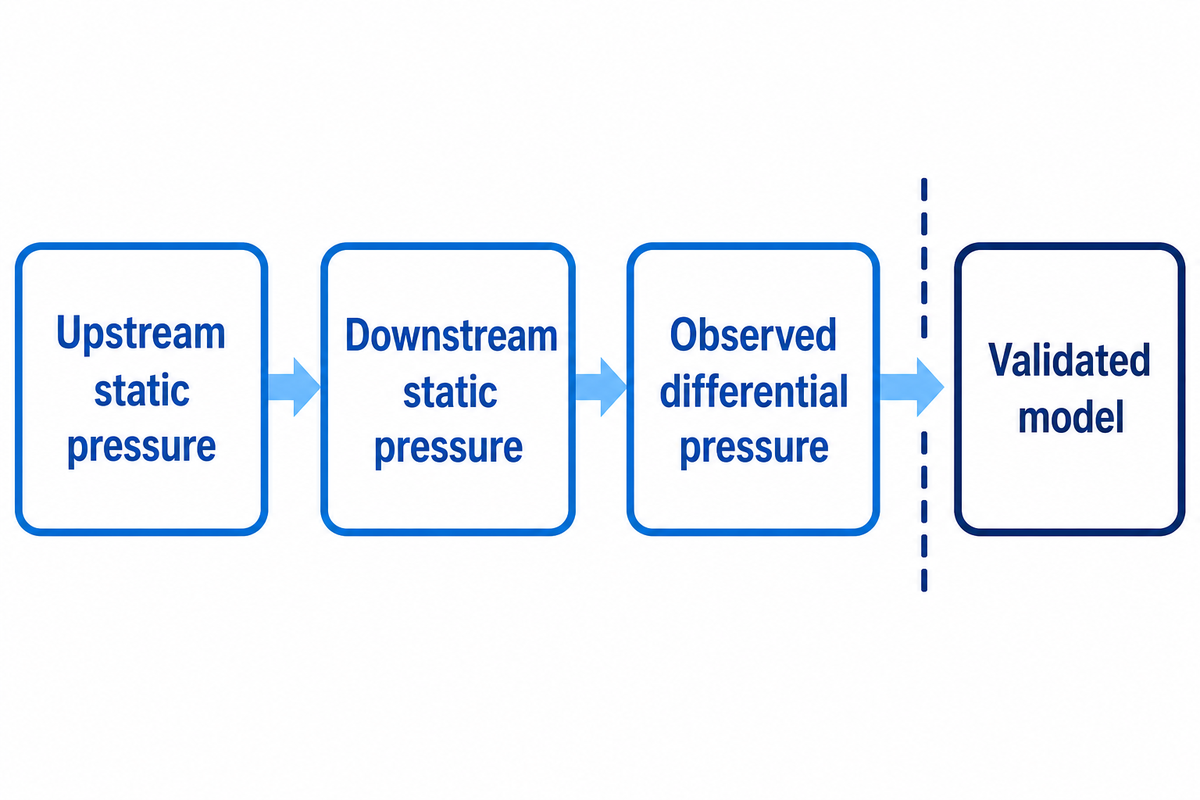
Pressure readings describe observed behavior. Calculate observed differential pressure as ΔP = upstream static pressure minus downstream static pressure, using readings from defined taps and consistent units. This calculation indicates the measured boundary. It does not predict a new cartridge curve, size a housing, or establish an acceptable operating limit.
Measured example, not a sizing curve
If the upstream reading is 3.20 bar and the downstream reading is 2.75 bar at the recorded condition, ΔP = 3.20 − 2.75 = 0.45 bar. Keep both raw readings, the 0.45 bar result, flow, fluid, temperature, boundary, and instrument status.
| Evidence category | Field | Illustrative entry | Interpretation |
|---|---|---|---|
| Boundary | Upstream pressure | 3.20 bar | Raw reading |
| Boundary | Downstream pressure | 2.75 bar | Raw reading |
| Hydraulics | Observed differential | 0.45 bar | Calculated difference |
| Hydraulics | Flow point one | 10 L/min | Buyer-defined example |
| Hydraulics | Flow point two | 20 L/min | Buyer-defined example |
| Hydraulics | Flow point three | 30 L/min | Buyer-defined example |
| Fluid | Temperature | 20 °C | Hypothetical condition |
| Fluid | Dynamic viscosity | 1.00 mPa·s | Hypothetical condition |
| Geometry | Cartridge length | 10 in | Example identity field |
| Metrology | Gauge range | 0–5 bar | Example instrument field |
| Metrology | Resolution | 0.01 bar | Example instrument field |
A different question may be asked and answered using a model. The model should be validated using the geometry, permeability and fluid properties of the media and may use flow regime correlations. A model may be useful, but its equipment type, calibration data, and validation range must stay beside the output.
A claimed pressure-drop reduction should belong to the model or measured configuration that produced it. Maintain the original input record so a revised model can’t erase the basis of the comparison.
How to calculate pressure drop through a filter?
Measure pressure at stated upstream and downstream taps, subtract the downstream reading from the upstream reading, and keep the units the same. Save the two raw measurements rather than the result. Report flow, temperature, fluid type or viscosity, cartridge and housing ID, loading state, and measurement instrument accuracy. If the measurement will be compared to a curve, make sure the curve is under the same conditions and boundary. The subtraction is an observed loss, not a universal cartridge predictor.
Reference capsule: The hypothetical 3.20 bar minus 2.75 bar example yields 0.45 bar by subtraction. ISO 3968 and university porous-media research support the broader discipline: calculation boundaries, flow, viscosity, geometry, calibration, and validation matter before an observed differential becomes a comparative or predictive result. Sources: ISO 3968 and UWM porous-media research.
Why Micron Rating Alone Cannot Predict Pressure Drop
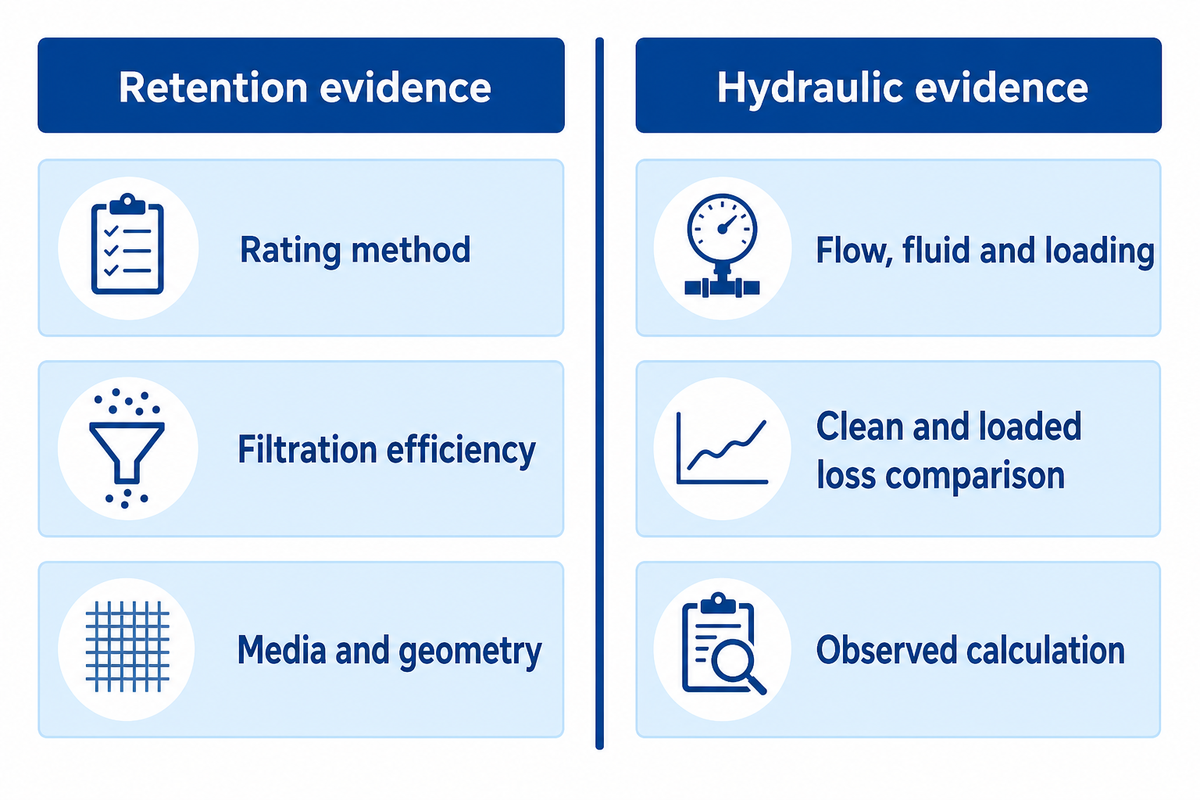
A micron rating claims a retention under a certain defined method; it doesn’t uniquely define hydraulic resistance. Pressure drop responds to the type and structure of the effective media, permeability, thickness, fiber or pore structure, pleat geometry, cartridge length, fluid properties, flow, and loading. Request retention and hydraulic data be given as separate records.
Retention evidence
- Rating method and test challenge
- Nominal, absolute, efficiency, or beta basis
- Particle range and stated condition
- Lot and sample identity
Hydraulic evidence
- Flow grid and fluid properties
- Media area and cartridge geometry
- Housing, ports, and tap boundary
- Clean or loaded curve state
A lower micron label can coincide with lower pressure loss when another design offers more area or different permeability. That doesn’t mean smaller ratings reduce loss; it means that the rating number can’t carry the hydraulic comparison by itself. Rating labels from different test methods can’t be interchanged either.
For depth filtration, a polypropylene filter may use polypropylene media with a changing structure through its depth. The gradient-density melt-blown cartridge guide separates that construction claim from hydraulic proof. Depth filters, pleated filter media, and other constructions can distribute flow differently, while fibre architecture and rigid support can alter the available path. Keep visible geometry separate with the melt-blown cartridge surface-finish guide.
State filtration ratings and filtration efficiency under their test methods. The level of particle retention isn’t the same record as hydraulic loss, and removal efficiency or particle removal claims can’t replace a pressure-drop curve.
Will a 5 micron filter reduce water pressure?
Any filter adds resistance, but the field effect can’t be inferred from “5 micron” alone. Flow, effective area, media structure, cartridge length, housing ports, water temperature, and accumulated loading all matter. Compare supplier curves or measurements only when those conditions and the rating method are stated on the same basis.
Reference capsule: The 5 µm label supplies a retention scale, not a pressure-drop curve. ISO 11170 separates hydraulic, mechanical, and separation characteristics, while measured research shows resistance depends on media and operating conditions. Standard record: ISO 11170. A buyer should therefore request two evidence tracks instead of converting microns into PSI.
Set a Changeout Rule from a Baseline, Not a Borrowed PSI Number
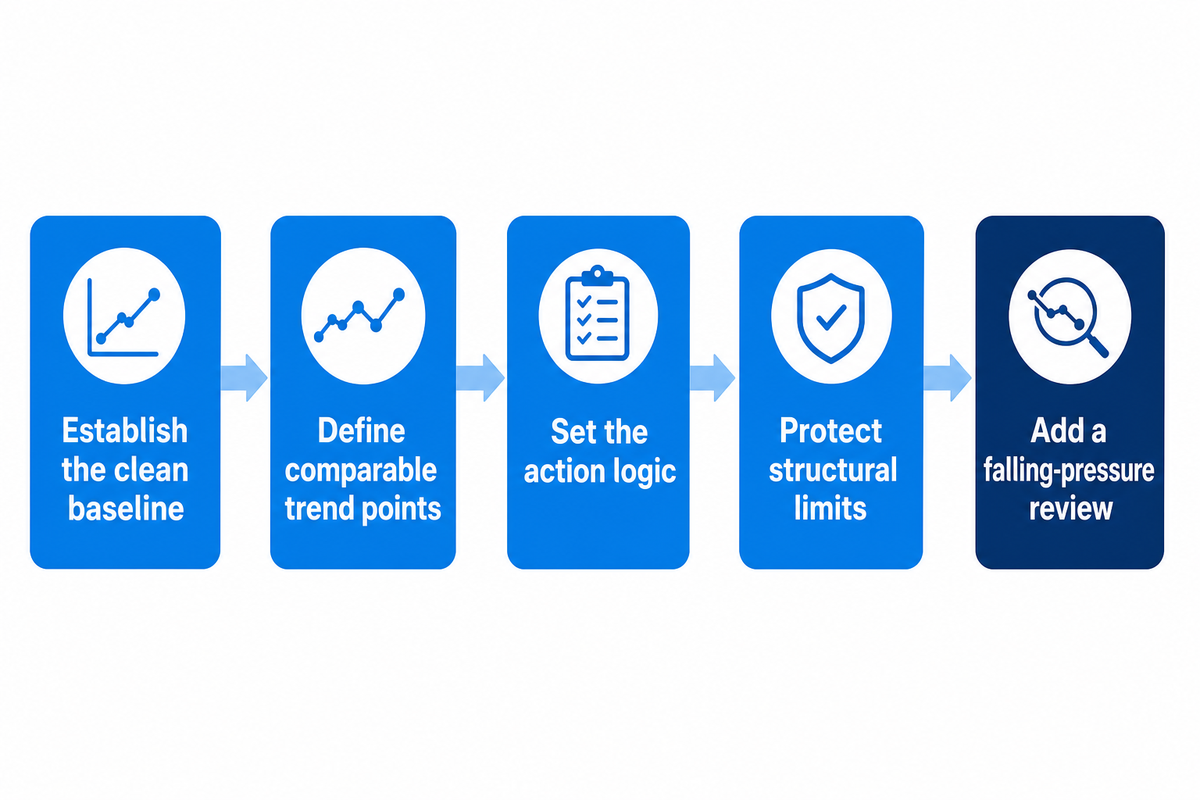
An acceptable changeout point is a site-approved operating rule, not a universal PSI copied from another system. Tie the rule to a clean baseline, comparable flow, and temperature, outlet quality or process consequence, service constraints, and a named decision owner. Keep structural pressure limits as a separate ceiling.
- Establish the clean baseline — save both pressures and the full operating condition after stable installation.
- Define comparable trend points — normalize only with an approved method and mark unlike conditions.
- Set the action logic — combine the approved differential with outlet quality, exposure, and process consequence.
- Protect structural limits — record cartridge and housing differential limits independently of the changeout trigger.
- Add a falling-pressure review — investigate bypass, seal, damage, flow, and sensing causes before declaring improvement.
A clean baseline doesn’t necessarily prove mechanical capacity. A cartridge structural limit, housing limit, pump capability, and approved operating trigger may come from different authorities, and must not be collapsed into one number. If one of the limits is missing, the RFQ is incomplete.
Monitoring frequency must be based on process risk and change rate. Each responsible component still needs its own limit, owner, and evidence source.
What is an acceptable pressure drop?
There’s no absolute value. The valid range depends on the system’s capacity, limits on cartridge and housing, a clean baseline, process consequence, outlet quality requirements, and approved operating method. Confirm the condition and both raw readings before applying the rule.
Reference capsule: A site may approve action at 0.80 bar above a condition-matched clean baseline, but that hypothetical trigger is not a mechanical rating. ISO 11170’s actual-service qualification boundary supports the distinction: operating criteria and structural capability need their own evidence and owners. Standard record: ISO 11170.
Diagnose Pressure-Drop Problems Before Replacing the Cartridge
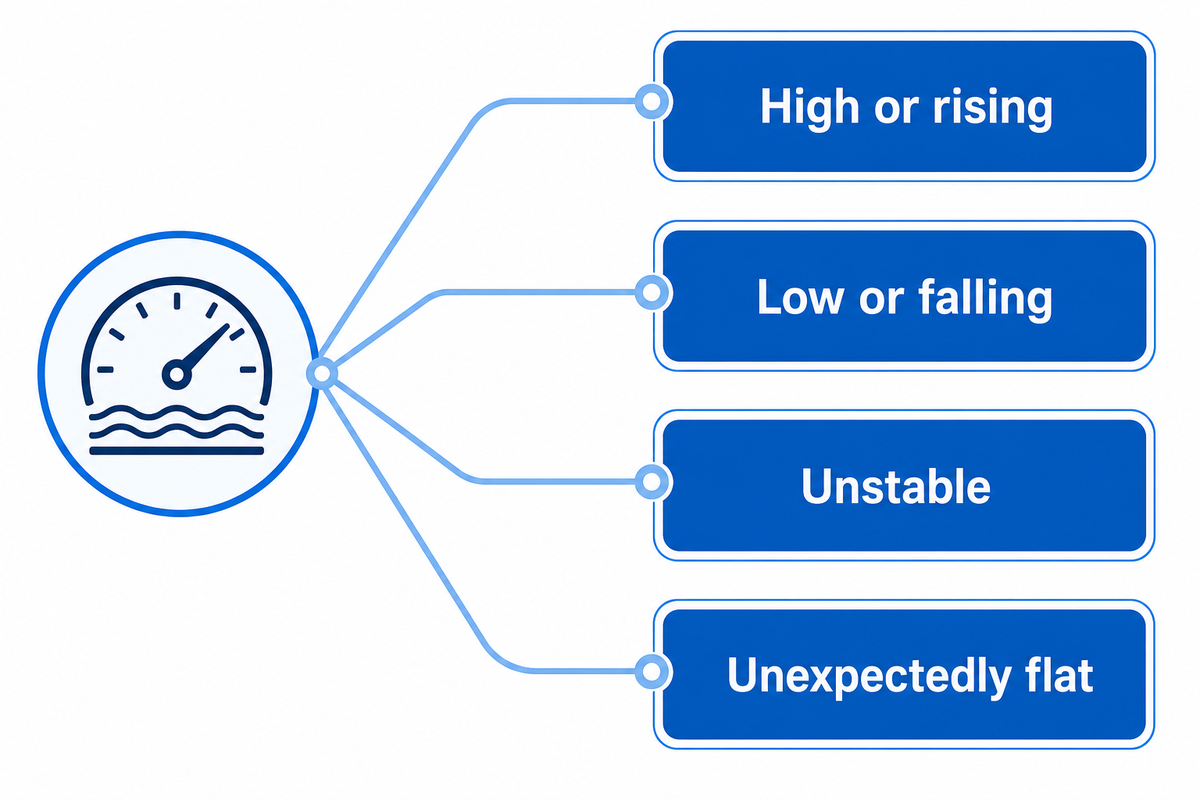
High, low, unstable, or unexpectedly unchanged differential pressure needs a branch diagnosis before cartridge replacement. Consider flow and fluid condition, element loading or damage, seals and bypasses, and wider system restrictions. Consider maintenance history, outlet quality, and other pressure indicators.
| Symptom | Check first | Evidence before action |
|---|---|---|
| High or rising | Flow, viscosity, taps, ports, loading | Condition-matched trend and inspection |
| Low or falling | Actual flow, bypass, seals, element integrity | Outlet quality and installation check |
| Unstable | Gauge range, pulsation, valves, sensing lines | Instrument and process time series |
| Unexpectedly flat | Tap blockage, equalizing path, changed flow | Independent flow and gauge verification |
Start with the sensing chain if a reading is physically implausible. Measurement-boundary reference: ISO 3968. If needed, examine the cartridge and seals. Low pressure drop isn’t evidence of healthy filtration.
A number of production or maintenance changes can move a signal. Consider temperature, fluid batch, cleaning, installation, and downstream restrictions. The goal is to determine the reason for an out-of-limits reading rather than to make a definite determination from one gauge.
An uneven distribution of fluid through the housing can make interpretation difficult after a change in the configuration. Consider a testable event, change in the operating condition, installation error or contamination as a branch diagnosis rather than a certain case.
Reference capsule: A 0.00 bar indication can mean no flow, an open equalizing path, reversed connections, blocked sensing lines, or a real low-loss condition. Mid-West Instrument’s scoped troubleshooting guidance supports the instrument branch; outlet-quality and inspection evidence must still test the bypass and element branches.
Pressure-Drop Data to Put in an RFQ
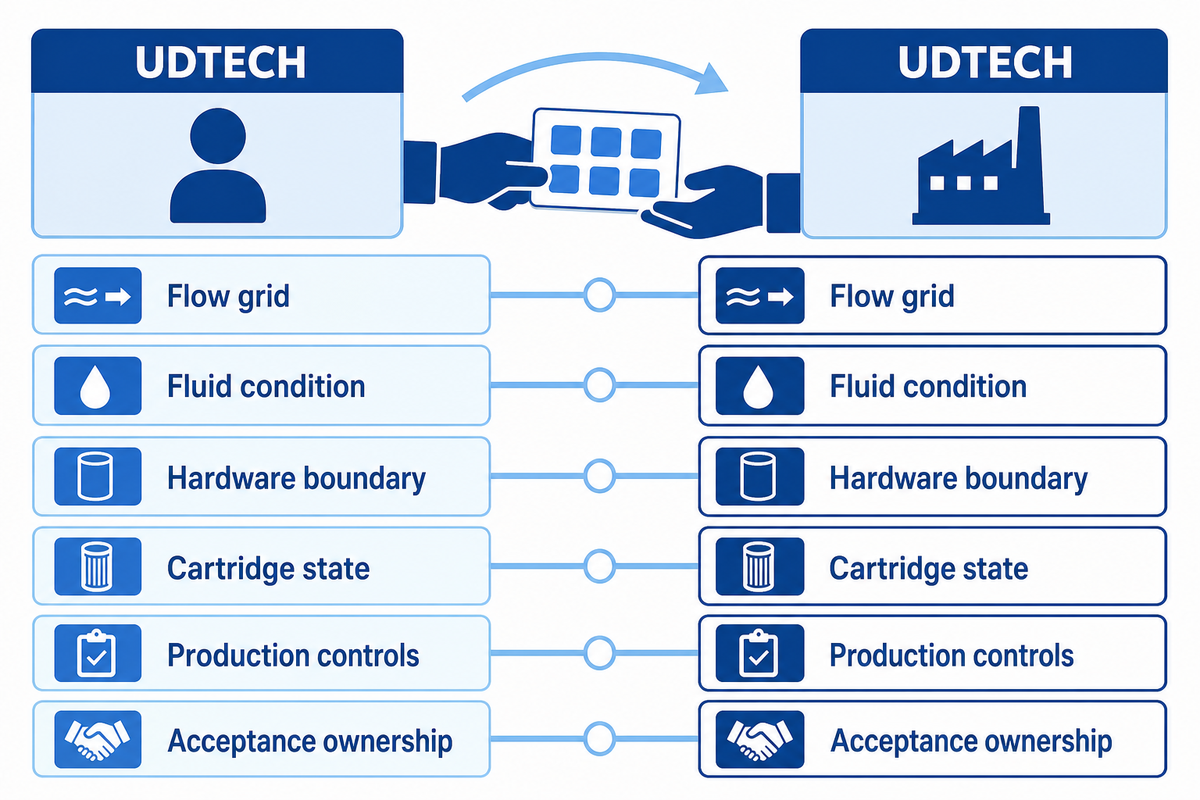
An RFQ separating cartridge hydraulic evidence from machine-process evidence, is useful. The first column describes how cartridge will be tested and accepted. The second column lists production inputs, inspection, calibration, samples and changes. An unlabeled PSI value can’t serve as an acceptance specification for either column.
RFQ checklist — copy these into your quote request:
| Parameter | Required statement | Why it matters | How to verify |
|---|---|---|---|
| Flow grid | Example: 10 L/min, 20 L/min, 30 L/min | Prevents one-point ranking | Raw curve data |
| Fluid condition | Example: 20 °C and 1.00 mPa·s | Defines resistance basis | Test record |
| Hardware boundary | Example: 10 in length and 70 mm diameter | Locates included loss | Rig drawing and photos |
| Cartridge state | Conditioning, clean or loaded | Keeps curves comparable | Method and sample ID |
| Metrology | Example: 0–5 bar range, 0.01 bar resolution | Makes small differences interpretable | Instrument record |
| Production controls | Relevant settings and change record | Connects output to process | Batch traveler or log |
| Sampling plan | Example: 3 cartridges per stated lot | Defines represented population | Approved sampling protocol |
| Structural limits | Example field: cartridge 2 bar, housing 5 bar | Separates capacity from changeout | Supplier documentation |
| Acceptance ownership | Named approver and disposition | Prevents scope gaps | Signed protocol |
Suzhou UDTECH Technology Co., Ltd. describes its scope as PP melt-blown, CTO activated-carbon, and wire-wound filter production equipment. A first-party description of a commercial scope and a first-party description of hydraulic scope differ. The filter cartridge production line solutions hub keeps the broader equipment routes separate. Freeze the cartridge evidence first, and then route equipment configuration and quotation questions to the filter cartridge production line page.
Ask who owns each acceptance item. The cartridge buyer may own the service condition and curve criteria, while the machine supplier documents controllable settings, inspection, calibration, sample identity, and change records. A machine FAT and cartridge service qualification are hand-offs, not substitutes, for each other.
Add an evidence matrix showing who will manufacture the sample, approve the method, witness the test, and close deviations. A food and beverage or drinking water project may require other evidence, in addition to pressure drop.
Reference capsule: An RFQ could request measured points at 10, 20, and 30 L/min, provided those points fit the intended duty. The numbers remain buyer-defined examples. Their value comes from attaching fluid, temperature, hardware, taps, sample identity, method, and acceptance owner. Hydraulic-test scope: ISO 3968.
How to Prove Lot-to-Lot Repeatability
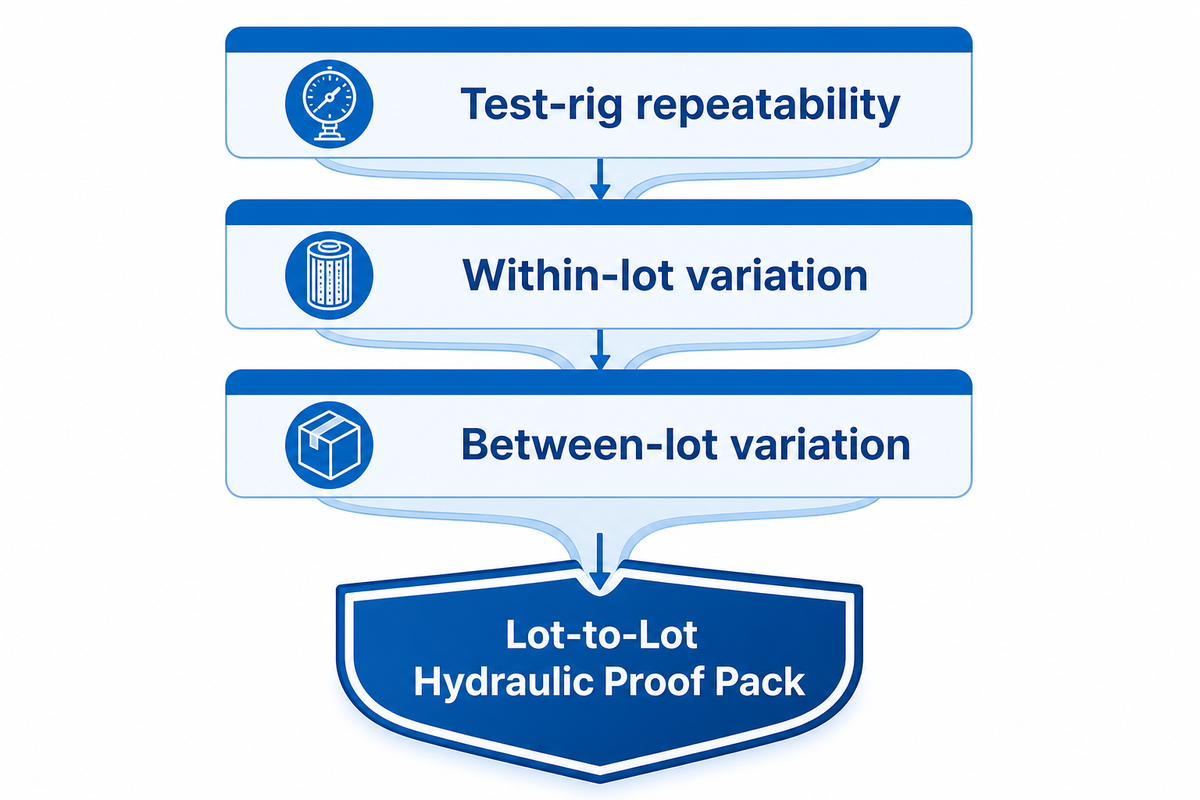
Lot repeatability means more than consistent readings on the same favored cartridge. Other sources of variation such as test-rig repeatability, variation among samples within the lot and variation among different lots should be considered. Every pressure-drop test result should be linked to the status of the instrument, sample identity, raw material lot, production conditions, deviations and sampling plan approved by the buyer.
The Lot-to-Lot Hydraulic Proof Pack should contain documentation about the method revision, diagram of the rig, raw paired readings, conditions, calibration status, sample and lot IDs, overlaid plots, production records, deviations and disposition. Leave raw data points so a reviewer can distinguish process drift from an intentional plotting or normalization choice.
Lot-to-Lot Hydraulic Proof Pack
- Repeat readings that show measurement repeatability
- Multiple sample identities that show within-lot variation
- More than one traceable production lot for between-lot comparison
- Raw material, settings, change records, and deviations
- Instrument range, accuracy, calibration, and test conditions
- Buyer-approved sampling logic and final disposition
Don’t implement a universal three-lot or fixed sample rule. The buyer’s process risk, governing method, expected variation, and consequence of failure should determine the design. If a supplier provides you with one golden curve, find out which population it represents, and how the sample was taken.
Reference capsule: A difference of 0.03 bar might not be significant. Interpret it in the context of test-rig variation, within- and between-lot variation, the measurement uncertainty of the instrument, and the approved acceptance criteria. It’s better to apply repeatability methodology, which has already been peer-reviewed, to separate these various components, rather than impose a completely arbitrary percentage. Method source: peer-reviewed repeatability methodology.
What Should Change in Pressure-Drop Procurement?
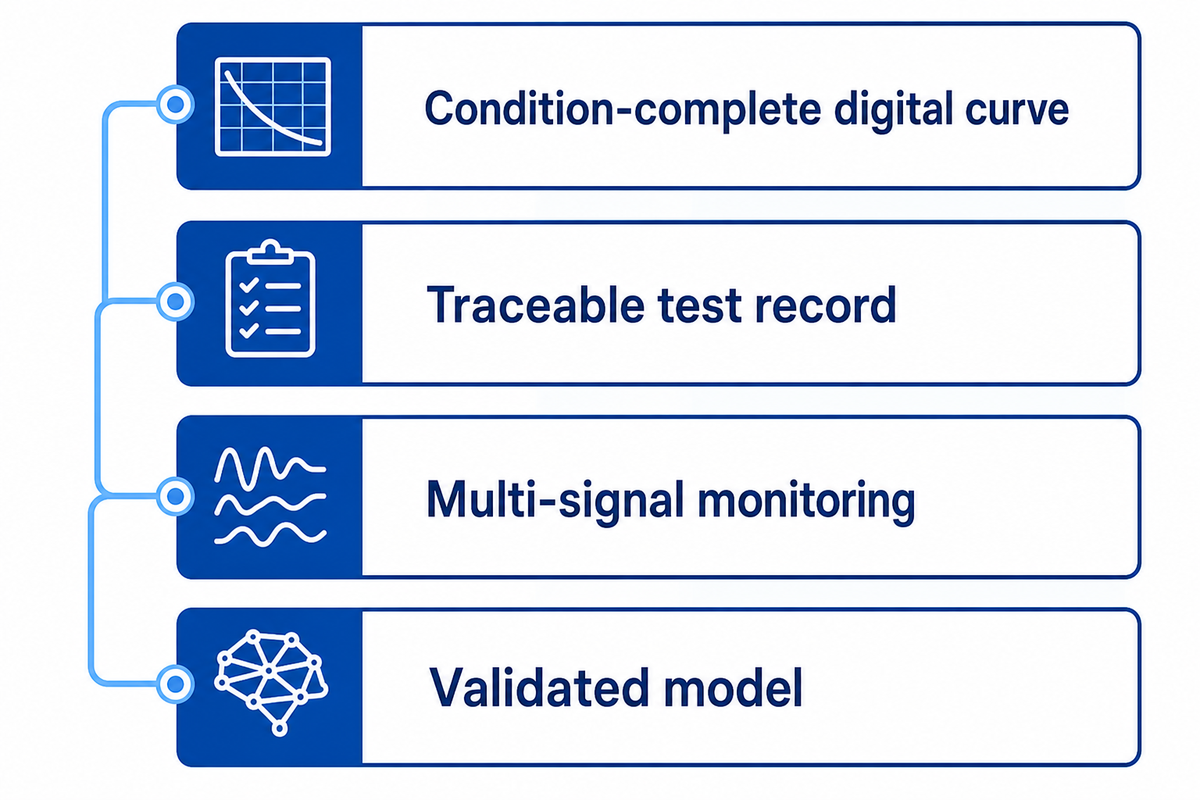
Pressure-drop procurement should favor condition-complete curves, traceable records, validated models, and multiple operating signals where they reduce uncertainty. This is a recommended evidence practice, not proof that the cartridge market has already adopted it. When evaluating a new claim by a supplier, examine the evidence it adds to a decision.
| Practice | Evidence added | Procurement consequence |
|---|---|---|
| Condition-complete digital curve | Raw points, units, basis, revision | Enables a same-basis check |
| Traceable test record | Sample, lot, instrument, method | Supports repeatability review |
| Multi-signal monitoring | Flow and quality context beside ΔP | Reduces single-signal ambiguity |
| Validated model | Inputs, equipment scope, range, error | Limits extrapolation risk |
Continuous pressure and temperature monitoring across filters is disclosed in a patent filed in 1995. Current adjacent research explores integrating other process variables, including differential pressure, flow, turbidity, particle load, or equipment state, but these examples do not establish cartridge-market adoption.
Calculation interest isn’t an adoption metric. Don’t rely on search demand to prove a change in buyers. A research prototype, AI answer, patent, or forecast still needs service scope, dated validation, and a consequence tied to the intended duty.
Reference capsule: The 1995 filing is a useful corrective to “new sensor” language, while 2025 adjacent studies show scoped multi-signal modeling. Current adjacent example: 2025 IEEE record. Neither date supplies a cartridge-market adoption rate. The defensible change is to request a validated range and traceable records, and not to promise novelty.
Frequently Asked Questions
What PSI should my cartridge filter be at?
Answer
There is no single correct PSI for every cartridge filter. Record upstream and downstream pressures, then compare their difference with the clean baseline and project-approved operating or changeout limit under matching flow and temperature. Housing rating, pump capacity, fluid, cartridge design, outlet-quality requirement, and process consequence affect what is acceptable. Use the responsible equipment and process authority’s limits rather than copying a threshold from another service.
Should you replace filter cartridges on a fixed schedule or based on condition?
Answer
Use a project-approved condition rule unless a validated service-exposure or hygiene requirement imposes a shorter fixed interval. Trend the differential against the clean baseline under comparable conditions, then combine it with outlet quality, process consequence, integrity evidence, and maintenance constraints. A calendar alone can change a sound element too early or leave an abnormal one in service. Record the reason for every change so the next cycle starts with evidence.
What are the signs that a filter cartridge needs replacing?
Answer
A condition-matched rise toward the approved changeout limit is one sign. Outlet-quality deterioration, integrity concerns, a service-exposure limit, or unacceptable process consequence can also require action. Verify the gauge, sensing lines, flow, temperature, seals, and installation first. An unexpected fall or flat trend may indicate bypass or damage rather than remaining life.
Why did pressure drop fall after cleaning or maintenance?
Answer
A lower reading may reflect restored flow area, but first confirm flow, temperature, gauge zero, tap condition, seals, and element installation. An unexpected fall can also indicate bypass or damage, so pair the pressure check with outlet-quality evidence.
When should a filter cartridge be changed?
Answer
Changeout should follow a project-approved rule, not a universal PSI number. Start with the clean baseline at known flow and temperature, trend the comparable differential, and act when the approved limit, outlet-quality requirement, service-exposure limit, integrity concern, or process consequence is reached. Verify gauges and tap lines before condemning the element. A sudden fall or unusually flat trend also deserves investigation because bypass, seal leakage, a damaged cartridge, or changed operating conditions can hide loading. Record the reason, condition, lot identity, and disposition for the next cycle.
Can I compare two supplier curves at the same nominal flow?
Answer
Only if fluid properties, temperature, cartridge geometry, housing and ports, tap locations, conditioning state, and rating basis also match. If a critical field is missing, request the underlying test conditions or reject the comparison rather than ranking curves by one point.
References & Sources
- ISO 3968:2017 lifecycle record — hydraulic-filter differential-pressure versus flow scope; confirmed current in 2023.
- ISO 11170:2013 lifecycle record — hydraulic, mechanical, and separation characteristic scope; confirmed current in 2024.
- University of Wisconsin-Milwaukee Porous Media Research Laboratory — geometry, permeability, fluid properties, experiment, and calibration context.
- Aerosol and Air Quality Research paper — clean and liquid-loaded media pressure-drop behavior under stated conditions.
- Peer-reviewed repeatability methodology — measurement, within-lot, and between-lot variation boundaries.
- NIST respirator study — bounded resistance measurement and treatment-history context; not transferred as a liquid-cartridge specification.
- US5702592A — historical monitoring disclosure, used only to test novelty claims.
Turn the Curve into a Testable RFQ
Bring your fluid, flow grid, temperature, cartridge geometry, test boundary, acceptance method, and lot-traceability needs. UDTECH can then discuss production-equipment scope without treating one unlabeled pressure value as a machine-performance promise.
UDTECH / ENGINEERING GUIDE
About UDMachine
UDTECH publishes practical production-line planning guides for filter cartridge making, assembly, finishing, and complete-line projects.
Use these guides to define cartridge type, process route, target output, available utilities, acceptance evidence, delivery scope, and installation constraints before selecting equipment.
Start with the cartridge
Media, diameter, length, end-cap format, and rated output define the real machine route.
Clarify the line scope
Utilities, layout, automation level, inspection points, and acceptance tests vary by project.
PRODUCT / CAPACITY / ACCEPTANCE
Prepare Your Line Brief
Product types
PP Melt Blown · String Wound · CTO Carbon · UDF Tube
Start with
Cartridge type · Target output · Country
Planning inputs
Utilities · Layout · Process · Acceptance standard
Response route
Submit the website inquiry form
Submit Project Brief